Live results per motor. Edit the illustrative inputs to calculate your mission.
Transmission, electrical & remaining cycle inputs
Each cycle has one linear acceleration, level cruise, constant-speed uphill cruise, one level deceleration and unpowered dwell. Set absent cruise, ramp or dwell segments to 0. Acceleration and deceleration durations also determine acceleration force.
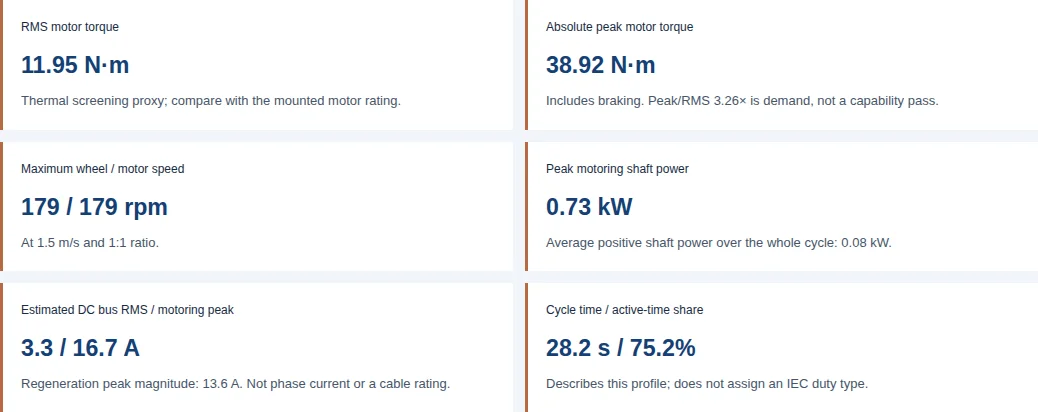
RMS motor torque11.95 N·mThermal screening proxy; compare with the mounted motor rating.
Absolute peak motor torque38.92 N·mIncludes braking. Peak/RMS 3.26× is demand, not a capability pass.
Maximum wheel / motor speed179 / 179 rpmAt 1.5 m/s and 1:1 ratio.
Peak motoring shaft power0.73 kWAverage positive shaft power over the whole cycle: 0.08 kW.
Estimated DC bus RMS / motoring peak3.3 / 16.7 ARegeneration peak magnitude: 13.6 A. Not phase current or a cable rating.
Cycle time / active-time share28.2 s / 75.2%Describes this profile; does not assign an IEC duty type.
Preliminary estimate: no thermal or safety approval. Equal tractive sharing, an editable 1.08 inertia allowance, level starts/stops and zero powered holding are assumed. Ramp launches, steering loads and grip require separate review. Read calculation limits.
Colored bars: signed motor torque (left axis). Dashed line: speed from zero to entered maximum (right axis). Width represents actual segment duration. Negative torque is braking; zero-duration segments are omitted. Scroll the chart on small screens.
Signed torque; segment-average speed, power and current. Negative values return energy. Zero-duration segments contribute no load.
Segment
Time (s)
Avg speed (m/s)
Avg motor rpm
Wheel torque (Nm)
Motor torque (Nm)
Avg shaft power (kW)
Avg DC current (A)
Acceleration
1.20
0.75
89.52
38.92
38.92
0.36
8.35
Level cruise
15.00
1.50
179.05
3.82
3.82
0.07
1.64
Ramp cruise
4.00
1.50
179.05
11.47
11.47
0.22
4.92
Deceleration
1.00
0.75
89.52
-38.30
-38.30
-0.36
-6.81
Unpowered dwell
7.00
0.00
0.00
0.00
0.00
0.00
0.00
Estimated average motor + inverter loss: 9.5 W under constant efficiency. Winding temperature is unknown without a loss map and mounted thermal data.
Next steps for this result
Check every operating point against the motor torque-speed envelope, including 38.92 N·m absolute peak and 11.95 N·m RMS per motor. Confirm pulse duration and mounting temperature with the supplier.
Check phase current from the selected winding torque constant and controller convention; verify regeneration acceptance at full charge and low temperature.
Measure traction, winding temperature and stopping behavior at full payload. Supply rotor inertia and wheel-load distribution before design release.
Use each output for a specific engineering decision
Finding
Decision
Evidence / boundary
Peak and RMS answer different questions
Check pulse torque and repeated loading separately; include negative braking torque.
Motor-sizing method [1]; actual torque-speed and thermal limits still need the selected motor data.
DC bus current is not motor phase current
Use power / bus voltage for a preliminary DC estimate. Use the winding torque constant and drive convention for phase current.
Controller power conversion [2]; voltage alone does not reduce torque-producing phase current.
Active-time share is not an S3 approval
Send the full profile, starts per hour, braking and inertia to the supplier.
Duty definitions [3], current IEC catalogue [4]; frequent starting or electric braking changes the classification question.
Motor topology does not prove fit
Compare mounted torque, wheel envelope, bearings and total installed cost.
Project-specific engineering comparison below. Public data here do not establish a universal axial-flux size or efficiency advantage.
How wheel demand becomes motor torque
The worksheet is a first-principles screening model. Let m be gross vehicle mass, n the driven-wheel count, r the effective wheel radius, G the speed reduction ratio, ηg transmission efficiency, v maximum speed and θ = atan(grade / 100). Tractive demand is divided equally by n; this division does not establish the actual vertical load on a driven tire.
Force allocation is a modelling assumption. Confirm individual wheel loads and adhesion separately.
Implemented formulas; SI units, signed forward torque
Quantity
Equation
Meaning / limit
Level rolling force per drive
Frr = (m / n) × g × Crr
g = 9.80665 m/s²; Crr must represent the actual tire and floor.
Acceleration force per drive
Facc = (m / n) × k × v / tacc + Frr
k is an editable rotating-inertia allowance, not a validated drivetrain inertia. Acceleration is level only.
Uphill steady force per drive
Framp = (m / n) × g × (sin θ + Crr cos θ)
Constant speed; no uphill launch, steering scrub or towing drag.
Deceleration force per drive
Fdec = Frr − (m / n) × k × v / tdec
Usually negative (regeneration). A sufficiently gentle stop can still require positive drive torque.
Shaft torque
Twheel = F × r; Tmotor = Twheel / (Gηg) when positive; Twheelηg / G when negative
Gear losses oppose power flow. No-load gear drag and efficiency variation are excluded.
Motor speed
rpm = v × 60G / (2πr)
Acceleration and deceleration are linear between 0 and this maximum; ramp cruise uses this same speed.
RMS and peak
Trms = √(Σ Ti²ti / Σti); Tpeak = max |Ti|
Only segments with nonzero duration contribute. There is no added design margin.
Load, inertia and RMS torque are separate checks in the manufacturer sizing method [1]. The wheel-force equations above are this worksheet’s analytical adaptation, not an IEC certification procedure.
Reproduce the warehouse AMR example
Illustrative inputs: 650 kg gross mass, two equal traction drives, 160 mm wheel, 1:1 direct drive, Crr 0.015, inertia allowance 1.08, speed 1.5 m/s and 3% uphill grade. One cycle has 1.2 s acceleration, 15 s level cruise, 4 s uphill cruise, 1 s deceleration and 7 s unpowered dwell.
The wheel radius is 0.08 m. Level rolling force is (650 / 2) × 9.80665 × 0.015 = 47.81 N per drive. Acceleration is 1.5 / 1.2 = 1.25 m/s², giving wheel torque (325 × 1.08 × 1.25 + 47.81) × 0.08 = 38.92 N·m. At 1:1 and unity transmission efficiency, motor and wheel torque are equal.
Calculated example, not a measured vehicle or product rating
Segment
Duration (s)
Signed motor torque (N·m)
Acceleration
1.2
38.92
Level cruise
15.0
3.82
Ramp cruise
4.0
11.47
Deceleration
1.0
-38.30
Unpowered dwell
7.0
0.00
Square each torque, multiply by its duration, sum, divide by 28.2 s, then take the square root: 11.95 N·m RMS per motor. Absolute peak is 38.92 N·m and maximum motor speed is 179.0 rpm. Select the warehouse example in the tool and export its CSV to reproduce all assumptions. These are demands to compare with hardware data.
Actual software execution captured 25 October 2026: the warehouse example uses the inputs listed above, a 48 V bus and 0.91 motor + inverter efficiency. The capture shows calculated demands, not measured motor performance, a customer case study or product approval. Site navigation and floating contact are outside this tool-only crop.
These are constructed scenarios, not customer installations. Each card uses the same calculation engine as the tool. Choosing its example mission loads the complete parameters; the CSV includes every input. Do not transfer a result between vehicles based on payload alone.
Warehouse AMR · 650 kg total
2 driven wheels · 160 mm diameter · 1:1 ratio · 1.5 m/s · 3% grade.
Next check: unequal traction sharing, tow resistance and actual wheel adhesion.
Electrical results: average, RMS and peak have different uses
Per segment, mechanical power is T × ω. During linear acceleration or deceleration, mean speed is half the maximum. The DC estimate is P / (Vη) while motoring and Pη / V during regeneration, with regeneration shown negative. For a linear current ramp from 0 to Ipeak, the integral of current squared is Ipeak² × duration / 3; using half the speed in an RMS calculation would underestimate that contribution.
Peak motoring DC current and regeneration peak are shown separately. Multiply synchronized drive currents by the number of motors for an approximate traction-only battery total. Add steering, controls, lift, communications and auxiliary loads separately. Coincident loads, sag and ripple require measurements before cable, battery or protection selection.
maxon’s controller explanation [2] distinguishes supply-side current from motor current. Doubling bus voltage at fixed power approximately halves DC current; it does not halve the motor phase current required for unchanged torque and winding. Phase current cannot be calculated here without the chosen motor’s torque constant and its RMS/peak convention.
Thermal screening and IEC duty classification
RMS torque helps screen repeated loading when torque tracks current, but does not predict winding temperature. Iron loss, AC winding loss, speed, ambient, stator-to-case resistance and mounting affect the thermal result. The tool’s constant-efficiency loss estimate covers motor plus inverter and cannot be assigned entirely to the stator.
Conceptual heat paths; no measured thermal resistance or temperature is implied. A tire is not assumed to be the sole heat sink.
Duty discussion guide; supplier must confirm classification for the actual profile
Duty concept
Distinction
Action for an AGV
S1
Continuous running at a load long enough to reach thermal equilibrium.
Check the mounted continuous operating envelope.
S3
Repeated load and de-energized rest; starting heating is insignificant.
Do not assign from active-time percentage alone.
S4 / S5
Starting is significant; S5 also includes electric braking.
Supply starts per hour, inertia, braking and complete time history.
Nonperiodic missions
Variable routes may not repeat the five-segment example.
Provide measured time series for supplier assessment rather than forcing an S3 label.
The S3/S4/S5 distinctions are described in ABB’s duty guide, Annex D [3]. The IEC catalogue [4] lists IEC 60034-1:2026, edition 15, published 13 March 2026; the 2022 edition is revised. The public catalogue confirms edition and scope; it does not validate a particular motor, insulation temperature margin or vehicle duty rating.
Direct drive, gearing and the cost of integration
Qualitative architecture tradeoffs; no universal size, efficiency or price advantage is claimed
Architecture
Potential benefit
Cost / integration check
Direct-drive axial flux hub
No gearbox stage; a disc-shaped package may suit the available wheel envelope.
Motor must supply wheel torque at low speed. Check radial envelope, bearings, seals, winding cost and assembly tolerances.
Geared axial flux drive
Reduction lowers required shaft torque while increasing motor speed.
Include gearbox cost, losses, reverse efficiency, lubrication, backlash and replacement access.
Geared radial-flux module
Established module options may reduce integration and service effort.
Compare actual installed axial length, bracket loads, torque-speed curve and maintenance against the custom option.
Higher DC bus voltage
Can reduce supply current at the same input power.
Check battery, inverter, insulation and auxiliaries as a system. Motor phase-current capability still depends on the winding.
These are engineering tradeoffs, not a product ranking. Request drawings, comparable mounted tests, prototype and production quotations, and a service plan before committing. Wheel diameter alone cannot prove that an axial flux hub fits.
Braking energy and vehicle safety boundaries
Review energy acceptance and independent stopping behavior. A holding brake is not automatically a rated service or emergency brake.
Regenerative torque requires an accepting electrical path. At high state of charge, low battery temperature or a disconnected BMS, review whether the pack can accept current and whether the bus requires a suitable buffer, brake chopper/resistor or a different controlled stopping strategy. The manufacturer’s four-quadrant guide [6] explains the possibility of returning energy during braking.
For a transparent energy illustration, a 650 kg vehicle at 1.5 m/s has ½mv² = 731.25 J of translational kinetic energy before rotating inertia is included. This is not the recovered energy or resistor rating: slope, conversion losses, pulse duration and repeated stops matter. DC capacitance absorbs only ΔE = ½C(Vmax² − Vnom²), using the actual allowable voltage range.
ISO 3691-4:2023 [5] covers driverless-truck safety and verification. This page does not derive protective-field dimensions, stopping acceptance limits, safety performance levels or compliance from its catalogue abstract. Verify the applicable edition, complete requirements and scanner/brake manufacturer instructions with the vehicle safety engineer.
Known assumptions, unknowns and misuse risks
All torque, power and current results are per motor; vehicle tractive demand is shared equally by the driven wheels.
One level acceleration and one level deceleration per cycle; ramp travel is constant speed at the entered maximum speed. Ramp acceleration, downhill travel, steering scrub and dynamic load transfer are excluded.
Rotating inertia allowance is an editable assumption (default 1.08), not measured rotor or gearbox inertia. No design safety factor is applied.
Dwell is unpowered, with zero motor holding torque. A powered hill hold requires a different torque profile.
DC current uses constant motor + inverter efficiency, also applied to regeneration. It excludes auxiliaries, PWM ripple and battery voltage sag. Bus current does not specify motor phase current.
Average system loss is a rough energy estimate, not winding heat or temperature. A loss map, thermal model and measured duty test are required.
Active-time percentage is descriptive, not an IEC S3 classification or safety approval. Peak/RMS ratio alone does not establish motor capability.
Evidence gaps that can change the selection
Risk / unknown
Why it matters
Minimum mitigation or alternative
Ramp launch or powered hill hold
The level-start and zero-holding assumptions can understate demand.
Supply a measured/custom slope and hold profile; size the brake and drive separately.
Grip and vertical wheel loads
Equal traction sharing does not establish adhesion or bearing capacity.
Measure wheel loads and floor friction, including wet floors and weight transfer.
Tire compound / cold storage
Rolling loss, traction and durability vary with load, temperature and surface.
Request compound-specific dynamic load-speed-temperature data. No universal hardness change, loss tangent or blowout temperature is established here.
Rotating inertia and towing drag
An assumed multiplier can miss substantial reflected inertia or trailer resistance.
Use measured inertia and force data; switch to a full drivetrain model where needed.
Thermal pulse capability
RMS below a nominal rating does not guarantee acceptable pulse temperature.
Use supplier thermal time constants, loss maps and mounted duty tests.
Custom integration cost
Prototype tooling, tolerances and qualification may dominate unit savings.
Compare total installed and service cost with a proven geared module before production release.
Turn the result into a reviewable RFQ
A filled worksheet starts an engineering review; measured acceptance evidence supports release.
Export the filled CSV and identify gross mass, wheel count, wheel diameter, ratio, force-sharing assumptions and every cycle duration.
Add installation drawings, actual vertical wheel loads, rotor/gear inertia, ambient range, tire data, powered holds and ramp starts absent from this model.
Provide bus voltage range, winding torque constant, phase-current convention and controller limits, battery regeneration constraints and brake ratings.
Agree mounted torque-speed, winding temperature, traction and stopping tests, including payload and battery extremes. Define project-specific pass criteria before ordering.
Torque, shaft power and DC current results are per motor under equal tractive sharing. Synchronized traction currents can be summed across drives; auxiliaries and unequal wheel loading require separate assessment.
Why use RMS torque as well as peak torque?
RMS accounts for squared torque over time and helps screen repeated thermal loading. Absolute peak includes braking and checks pulse demand. Neither result alone establishes the mounted motor temperature or allowable peak duration.
Does this calculator certify an IEC S3 rating?
No. Active-time percentage describes the entered profile. S3 assumes insignificant starting heating; significant starts or electric braking require a different duty discussion. Ask the motor supplier to classify the complete profile under the applicable IEC 60034-1 edition.
Is 48 V always better than 24 V?
At the same input power, a higher bus voltage reduces DC current. It does not automatically reduce the phase current needed for the same motor torque. Compare the complete battery, inverter, winding and auxiliary system.
Can bus current determine inverter phase-current rating?
No. The drive converts voltage and current. Phase-current selection needs the motor torque constant, current convention, torque-speed curve and controller continuous and pulse limits.
What happens when I clear a field or enter an invalid value?
Results and filled exports are withheld until every required input is within its displayed range. Correct the marked fields, restore the warehouse example, or use the blank worksheet for an engineering review.
How do acceleration and deceleration times affect the result?
Each is the actual time between zero and maximum speed in this cycle. Shorter times increase inertial force. The same duration is used in force and RMS calculations; there is no separate hidden acceleration time.
Can a zero-duration segment create peak demand?
No. Cruise, ramp and dwell can be omitted with zero duration and then contribute no torque, power or RMS load. A complete modeled motion cycle still requires positive acceleration and deceleration times.
Are ramp launches, downhill travel and steering scrub included?
No. Starts and stops are level; ramp cruise uses the entered maximum speed. Supply a custom measured profile for simultaneous incline acceleration, downhill braking, steering scrub, trailer drag or powered hill holding.
What does the rotating inertia allowance mean?
It scales translational inertial demand to approximate rotating components. The default 1.08 is illustrative, not a measured universal value. Replace it with a drivetrain-specific estimate; reflected motor and gear inertia may require a detailed model.
Does the loss estimate predict winding temperature?
No. It uses constant motor-plus-inverter efficiency to estimate average conversion loss. Winding temperature needs motor loss maps, thermal resistances, time constants, mounting conditions and a representative duty test.
Can an axial flux motor fit inside any AGV wheel?
Fit depends on the actual motor and wheel drawings, bearings, brake, seals, air gap and load path. Disc geometry may help packaging, but no universal thickness, wheel size or torque advantage is established by this worksheet.
Does regenerative braking guarantee a safe stop?
No. Confirm battery and DC-bus energy acceptance and independent braking behavior across payload, slope, temperature and battery extremes. Vehicle safety verification needs the applicable ISO 3691-4 requirements and component instructions.
What should I send for a sizing review?
Send the filled CSV, installation drawings, measured wheel loads, tire and floor data, rotor and gearbox inertia, ambient range, bus limits, phase-current ratings, powered holds, ramp starts and intended acceptance tests.
Primary sources and evidence limits
By CustomAxialFlux Engineering Editorial. Substantive review: . Manufacturer guides support methods; standards catalogue pages establish identity and scope. Illustrative calculations and architecture comparisons are the worksheet’s engineering analysis, not measured product claims. Full standard clauses and hardware certification are outside the evidence available here.
Send the calculated profile with installation and thermal details for a project-specific review. Motor dimensions, peak duration, temperature margin, cost and delivery timing require confirmation for the chosen design.